Introduction
Creating effective UX research findings reports is crucial for translating user insights into actionable design improvements. These reports serve as a bridge between research and design, ensuring that user feedback directly influences product development. This 15-step guide will help you create comprehensive, clear, and impactful UX research findings reports by integrating user insights and fostering data-driven decisions.
1. Define the Purpose of the Report
Clarify the Goals and Objectives
Begin by understanding the primary goals and objectives of your report. Are you aiming to improve a specific feature, redesign an interface, or understand user behavior more deeply? Clear goals will guide the focus of your research and the structure of your report. Setting precise objectives helps ensure that the research findings align with the overall business goals and provide actionable insights for the design team.
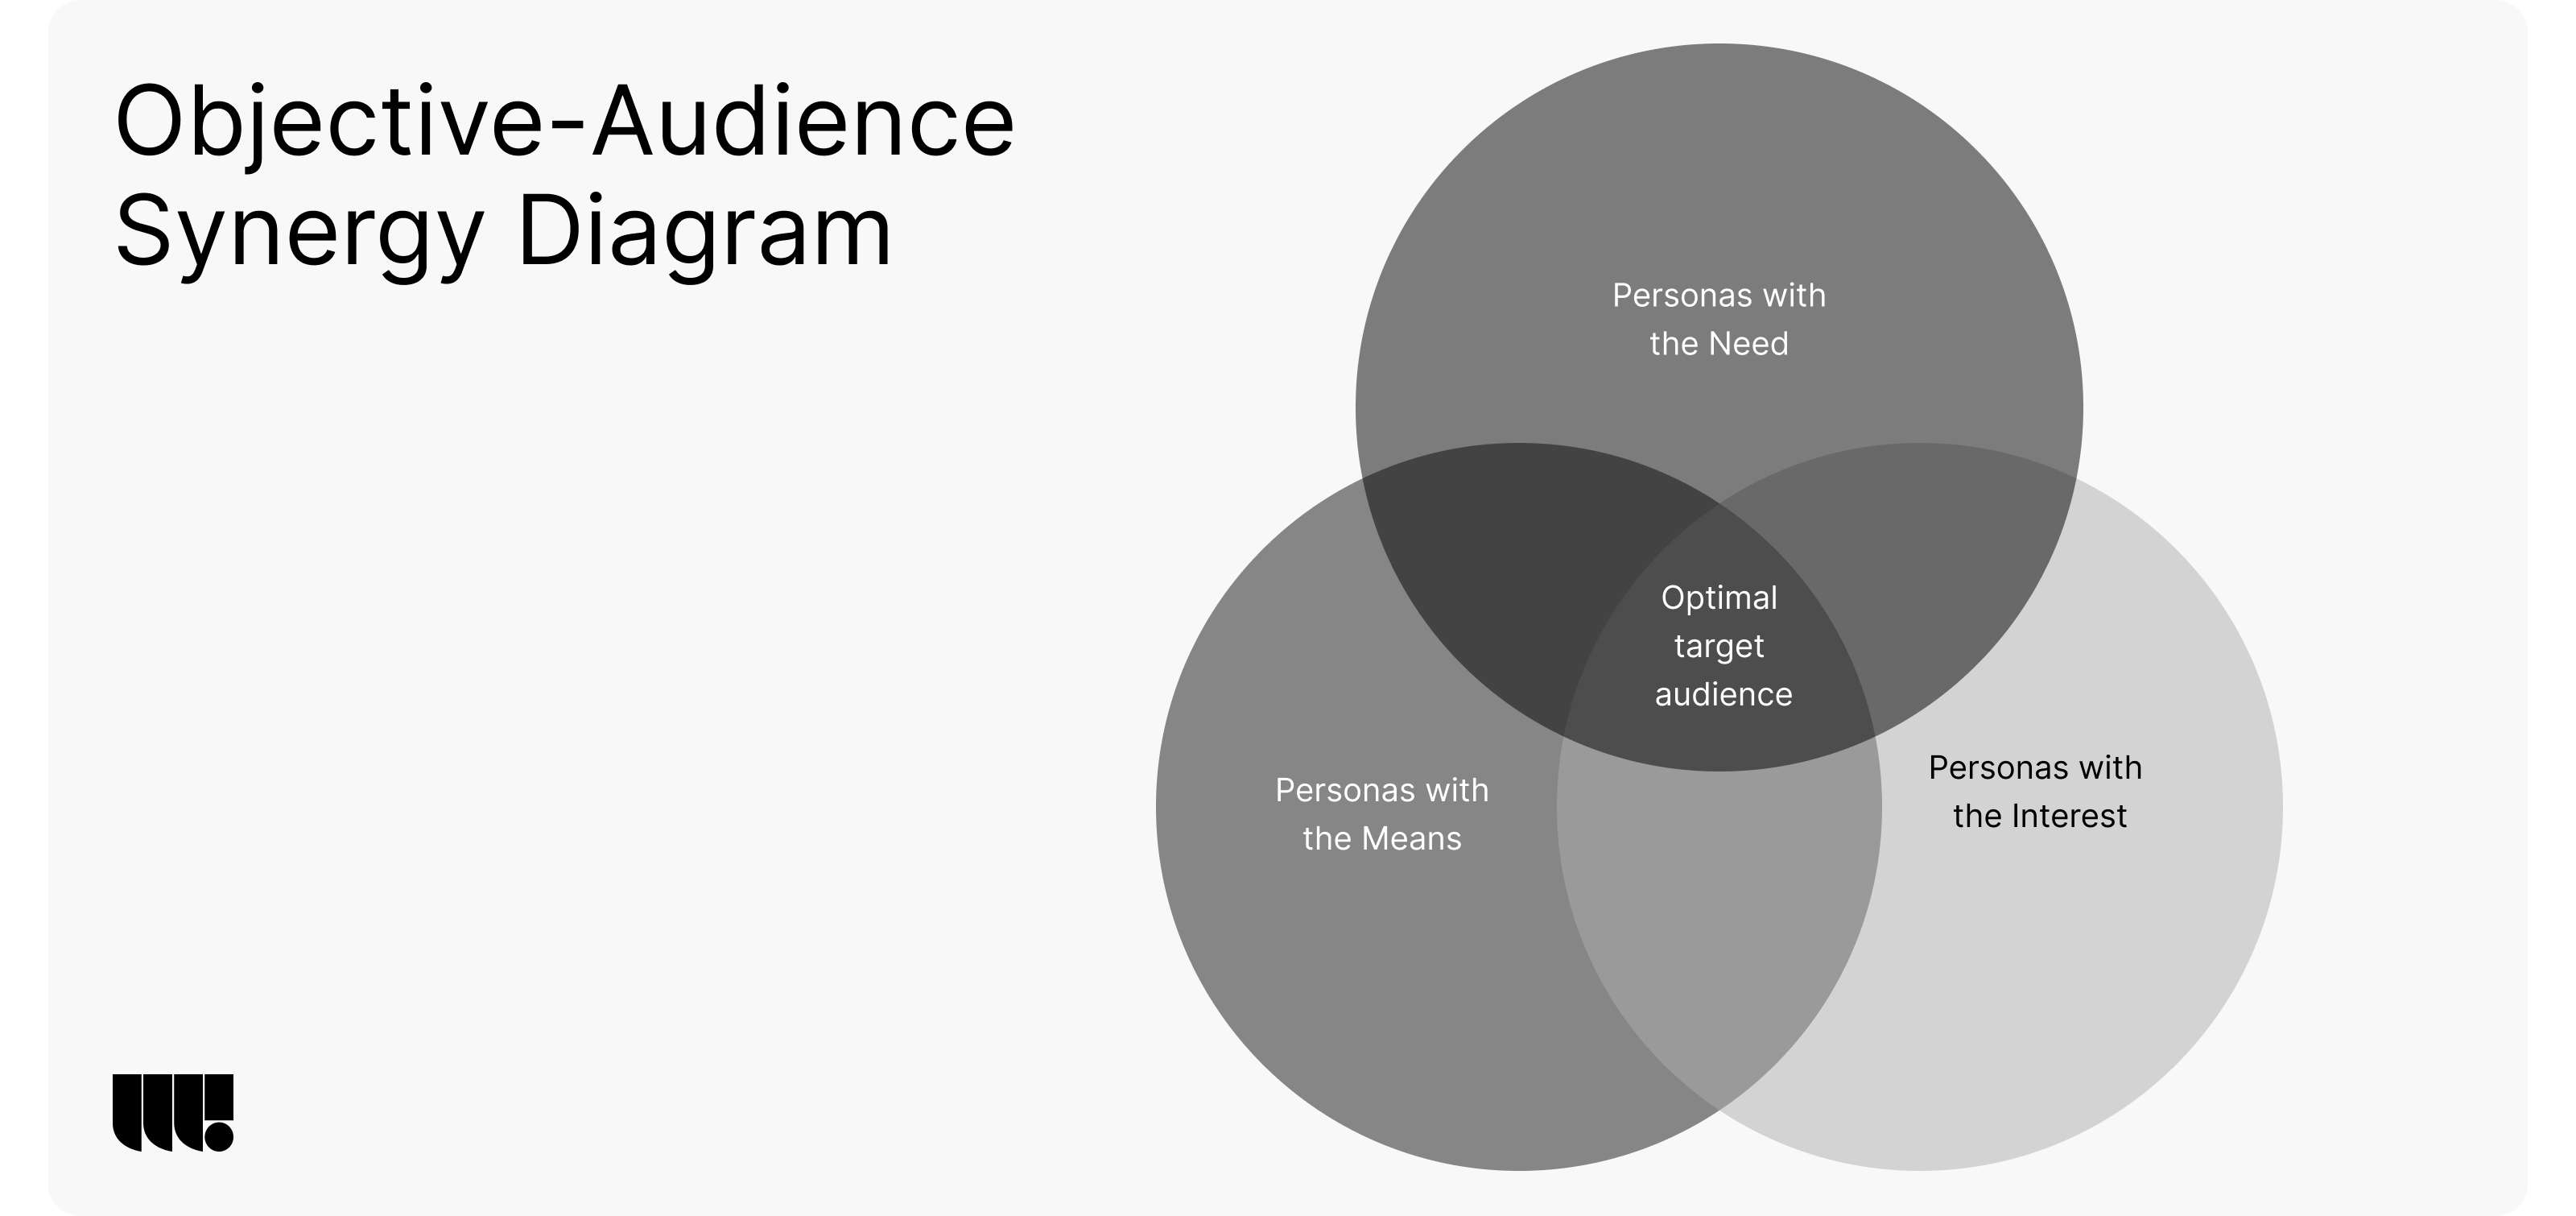
Identify the Target Audience
Determine who will read the report. Is it for designers, developers, product managers, or stakeholders? Understanding your audience helps tailor the report’s language, detail level, and presentation style. Different audiences require different levels of detail and focus areas; knowing this can help make your report more relevant and impactful.
2. Assemble the Research Team
Assign Roles and Responsibilities
Form a team with diverse expertise, including UX researchers, designers, and data analysts. Assign specific roles to ensure each team member knows their responsibilities, from data collection to report writing. Clear role definitions prevent overlaps and ensure comprehensive coverage of all necessary tasks, enhancing the overall efficiency and effectiveness of the research process.
Ensure Diverse Expertise and Perspectives
Diversity in your team brings various perspectives, enriching the research process and the quality of insights. Encourage collaboration and knowledge sharing to leverage the team’s full potential. Diverse expertise helps in identifying a broader range of user needs and behaviors, leading to more holistic and inclusive design solutions.
3. Plan the Research Approach
Choose the Appropriate Research Methods
Select research methods that align with your objectives, such as surveys, interviews, usability testing, or analytics. Each method should provide valuable data to address your research questions. The choice of methods should be driven by the nature of the project, the type of insights needed, and the resources available. For instance, usability testing can provide in-depth insights into user interactions, while surveys can offer broad quantitative data on user preferences.
Develop a Research Timeline
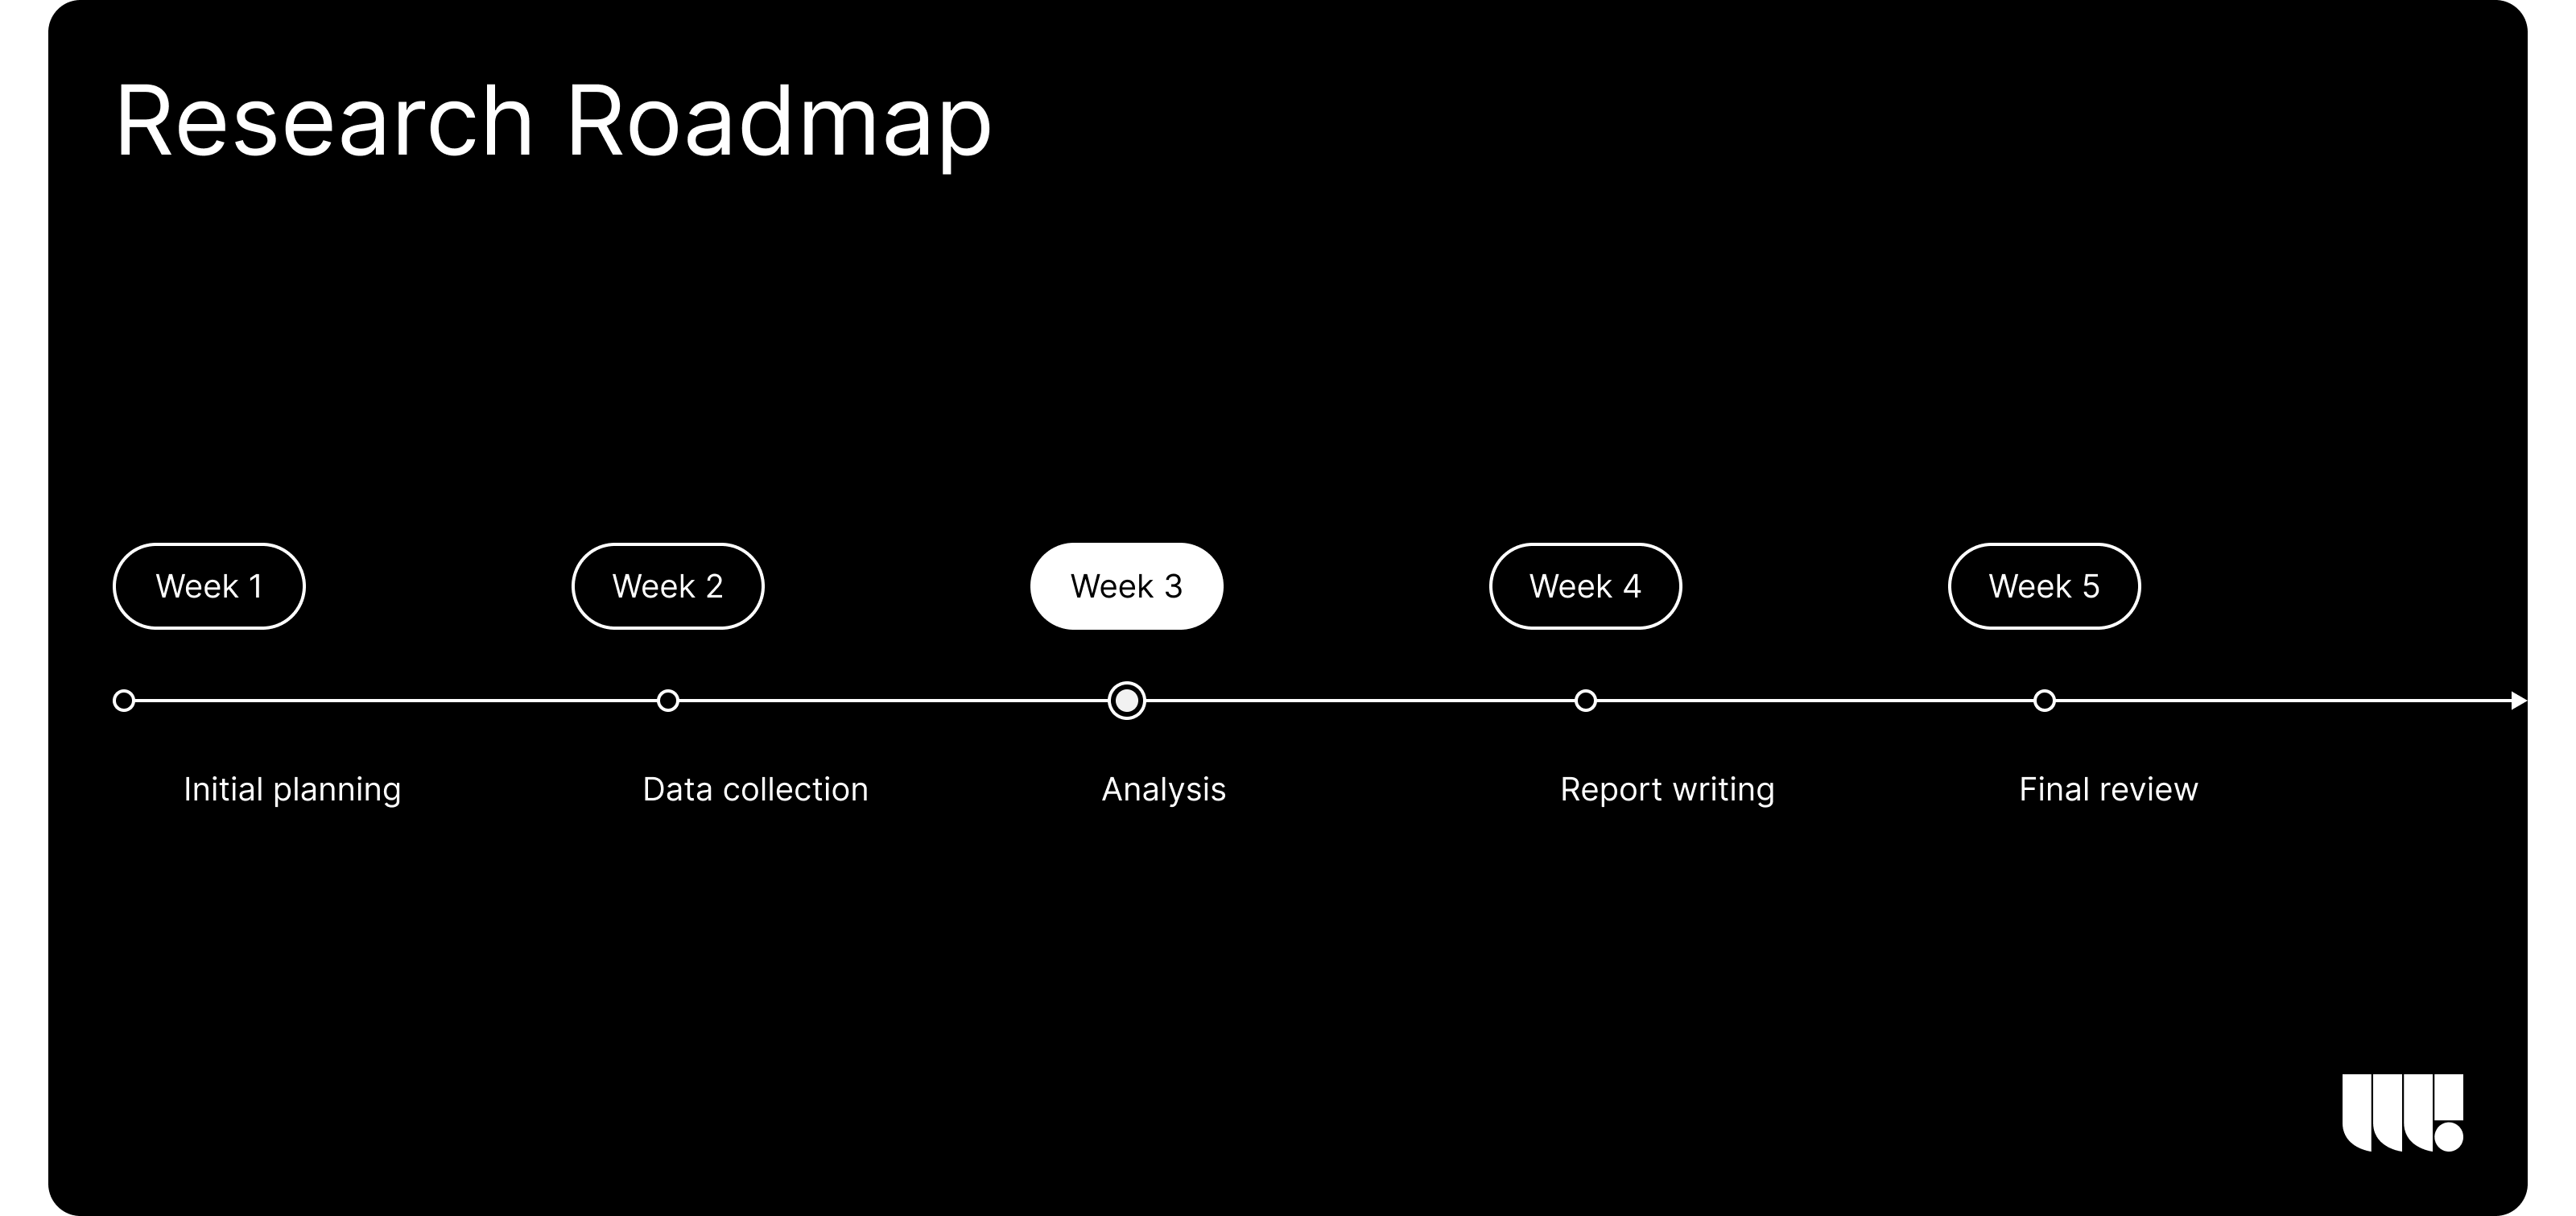
Create a timeline that outlines each phase of the research process, from planning and data collection to analysis and reporting. A clear timeline ensures the project stays on track and deadlines are met. This timeline should include milestones for each major task, such as initial planning, data gathering, analysis, report drafting, and final review. Having a structured timeline helps manage expectations and ensures that all team members are aligned on the project’s progress and deadlines.
4. Conduct Thorough Research
Collect Qualitative and Quantitative Data
Gather data through your chosen methods. Qualitative data offers in-depth insights into user experiences, while quantitative data provides measurable evidence of user behaviors and preferences. Combining both types of data gives a more comprehensive view of user interactions and needs, enabling a more nuanced understanding of the user experience.
Share your project idea with us! If our partnership isn't the right fit, we're happy to provide valuable insights that could still benefit you.
Ensure Accuracy and Reliability
Maintain high standards for data accuracy and reliability. Verify the data sources and cross-check findings to ensure the validity of your insights. Accurate and reliable data is crucial for making informed design decisions and building trust in the findings. Implementing systematic data validation processes, such as triangulating data from multiple sources, helps ensure the robustness of your research outcomes.
5. Organize and Analyze Data
Categorize Data for Easy Reference
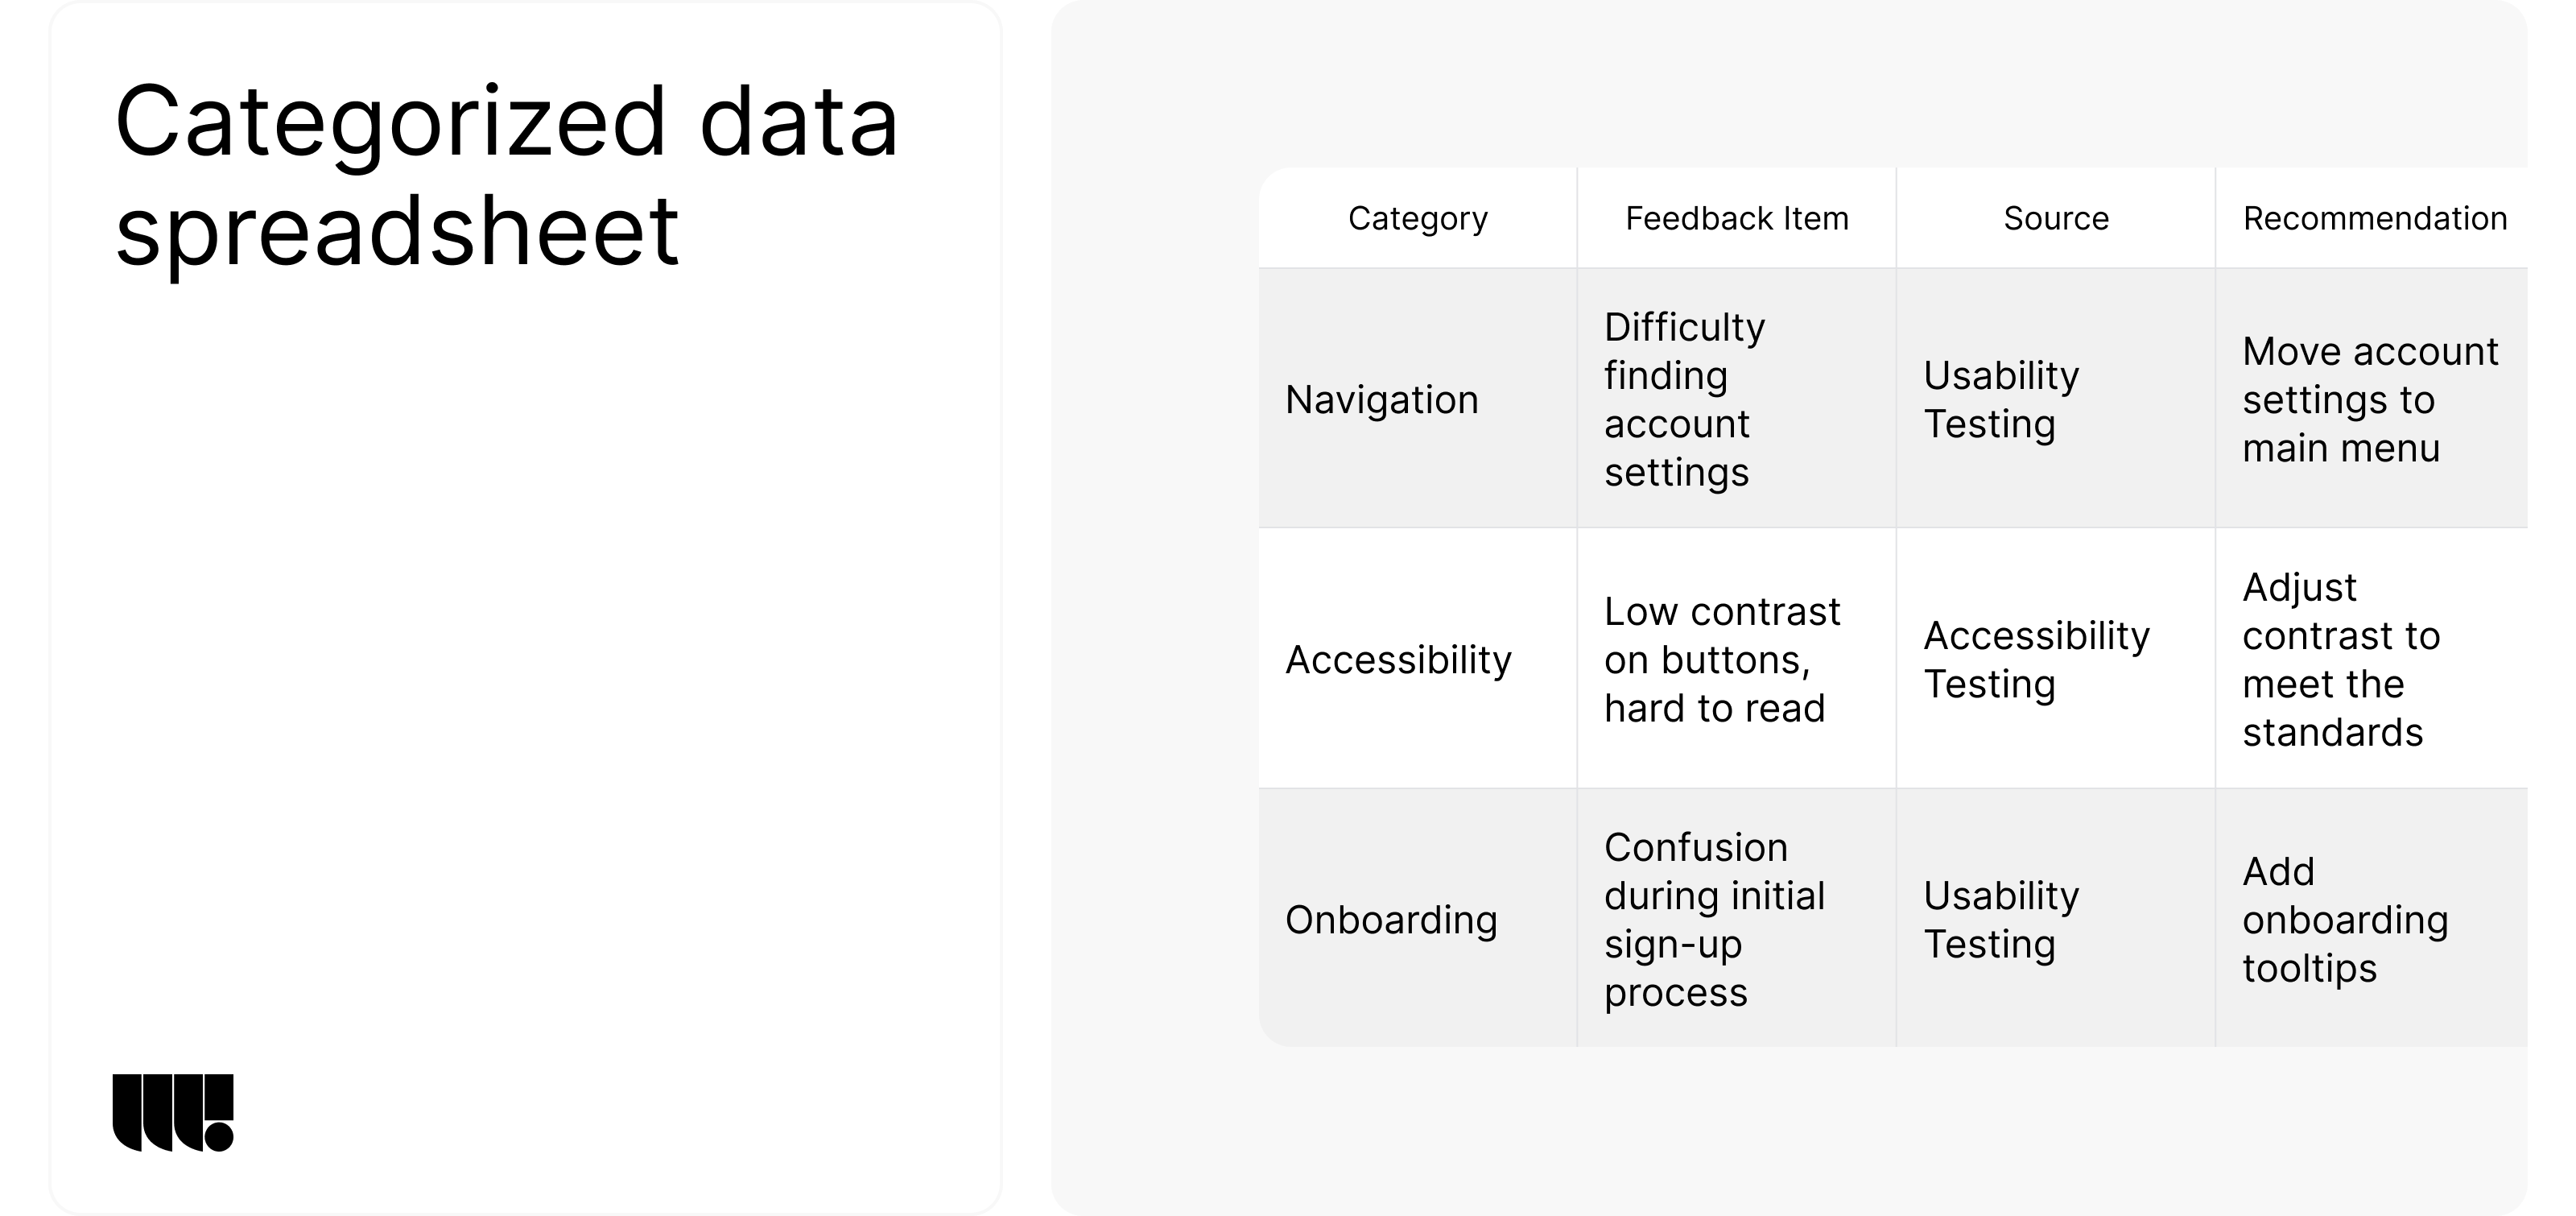
Organize your data into categories or themes to simplify analysis. Use tools like spreadsheets or specialized software to keep your data structured and accessible. Categorizing data helps in identifying patterns and trends more easily and makes it simpler to reference specific findings during report writing. Common categories might include user feedback on specific features, general usability issues, and suggestions for improvements.
Use Tools for Data Analysis and Synthesis
Utilize data analysis tools to identify and structure patterns and trends. Tools like Notion and Airtable can help you synthesize findings effectively. These tools provide powerful analytical capabilities that can reveal deeper insights and correlations within your data, facilitating more informed and data-driven design decisions.
6. Identify Key Findings and Insights
Highlight Significant Trends and Patterns
Identify the most important trends and patterns in your data. These findings should directly address your research objectives and provide valuable insights for the design team. Highlighting significant trends helps focus attention on the most critical aspects of the user experience that need to be addressed.
Extract Actionable Insights
Translate data into actionable insights. What do the findings suggest about user needs, preferences, and pain points? How can these insights inform design decisions? Actionable insights are those that can be directly applied to improve the user experience, making the findings not just informative but also practical and useful for the design process.
7. Develop Clear Research Objectives
Align Objectives with Business Goals
Ensure that your research objectives align with the broader business goals. This alignment ensures that your findings are relevant and valuable to the organization’s strategic direction. Research objectives should support the overall vision and goals of the business, contributing to improved user satisfaction and business success.
Ensure Objectives are Specific and Measurable
Clearly define your objectives in specific and measurable terms. This clarity helps guide the research process and facilitates the evaluation of your findings. Specific and measurable objectives make it easier to track progress and assess the impact of your research on the design process and overall user experience.
8. Structure the Report
Create a Logical Flow for the Report
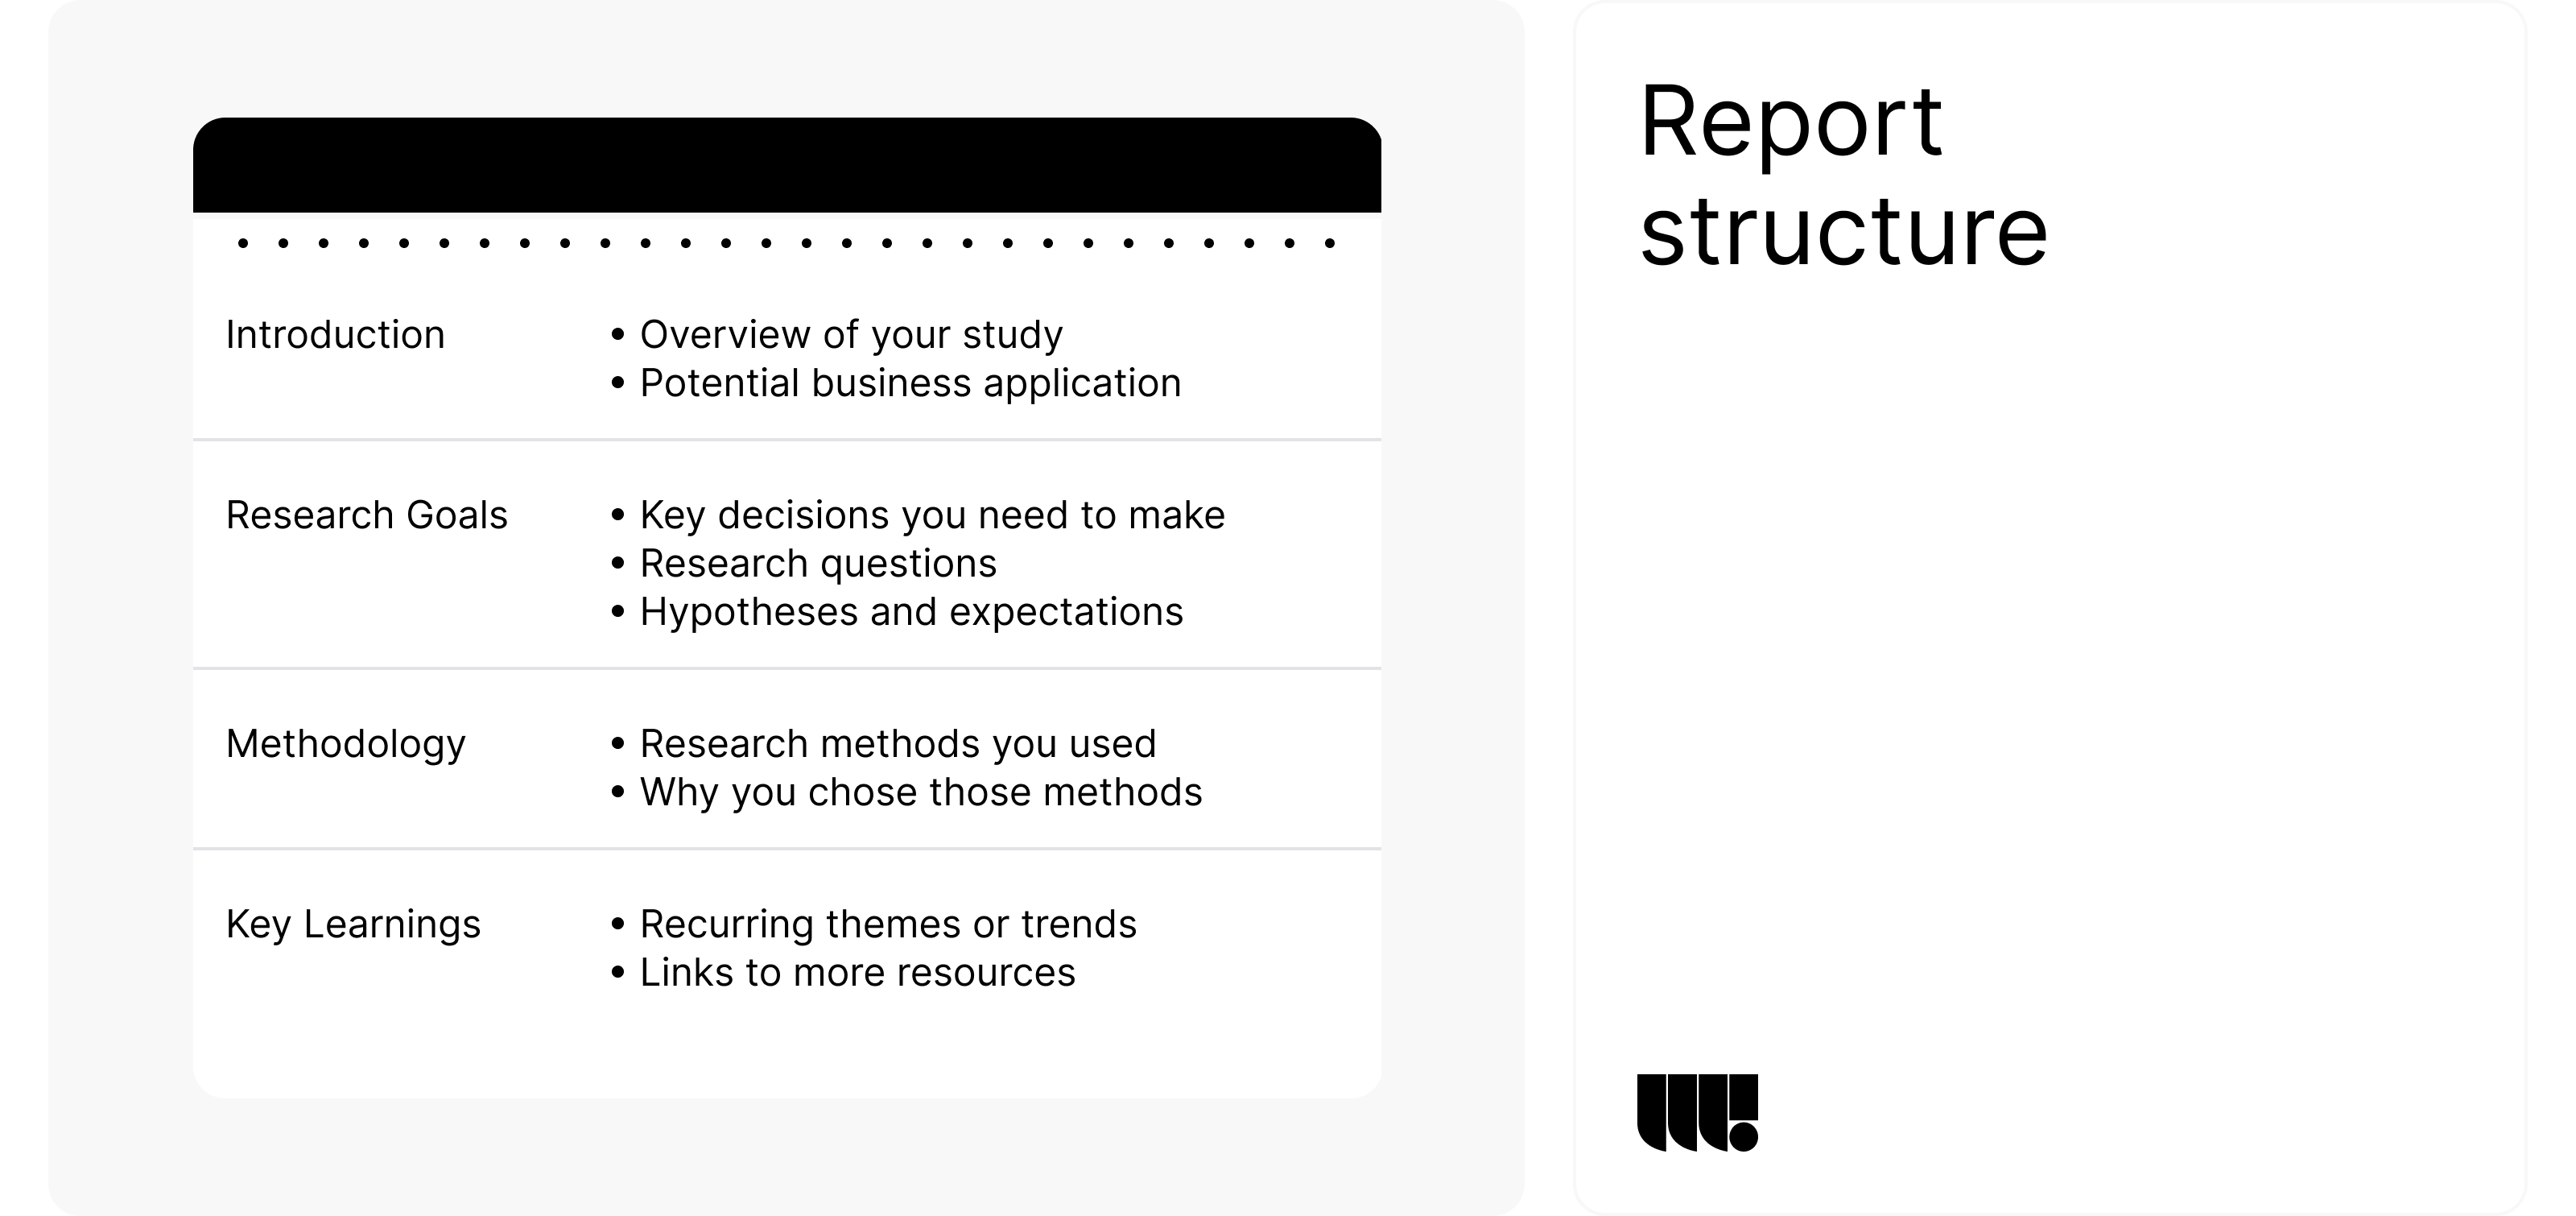
Organize your report in a logical sequence. Start with an executive summary, followed by detailed sections on methodology, findings, and recommendations. A logical flow helps readers follow the narrative of your research easily, enhancing their understanding and engagement with the report.
Divide the Report into Clear Sections
Divide the report into distinct sections, each with a clear heading. This structure makes the report easier to read and understand. Clear sections allow readers to quickly find the information they need, improving the usability and accessibility of the report.
9. Write the Executive Summary
Provide a Concise Overview of the Report
Summarize the report in a concise executive summary. Highlight the key findings, insights, and recommendations. This section should give readers a quick understanding of the report’s main points. An effective executive summary provides a snapshot of the entire report, making it easier for stakeholders to grasp the essential insights without needing to read the full document.
Summarize Key Findings and Recommendations
Ensure that the executive summary includes the most important findings and actionable recommendations. This helps stakeholders grasp the report’s significance at a glance. Including key findings and recommendations in the summary ensures that the most critical insights are communicated upfront, facilitating quick decision-making.
10. Detail the Methodology
Describe Research Methods Used
Detail the research methods used, including the rationale behind choosing them. This transparency builds trust in your findings and shows the thoroughness of your approach. Providing detailed descriptions of your research methods helps readers understand the context and limitations of your findings, enhancing their credibility.
Explain the Rationale Behind Chosen Methods
Explain why specific methods were chosen and how they align with the research objectives. This contextual information helps readers understand the validity and relevance of the findings. Clear explanations of your methodology demonstrate the rigor and thoughtfulness of your research process, reinforcing the reliability of your insights.
11. Present Key Findings and Insights
Use Clear and Concise Language
Present your findings using clear and concise language. Avoid jargon and ensure that the insights are easily understandable. Clear communication is essential for ensuring that your findings are accessible to a broad audience, including non-experts.
Highlight the Most Important Findings
Focus on the most critical findings that address the research objectives. Highlight these insights prominently to ensure they capture the readers’ attention. Emphasizing the most significant findings helps ensure that the key messages of your report are communicated effectively and remembered by your audience.
12. Include Visualizations and Data Representations
Use Charts, Graphs, and Infographics
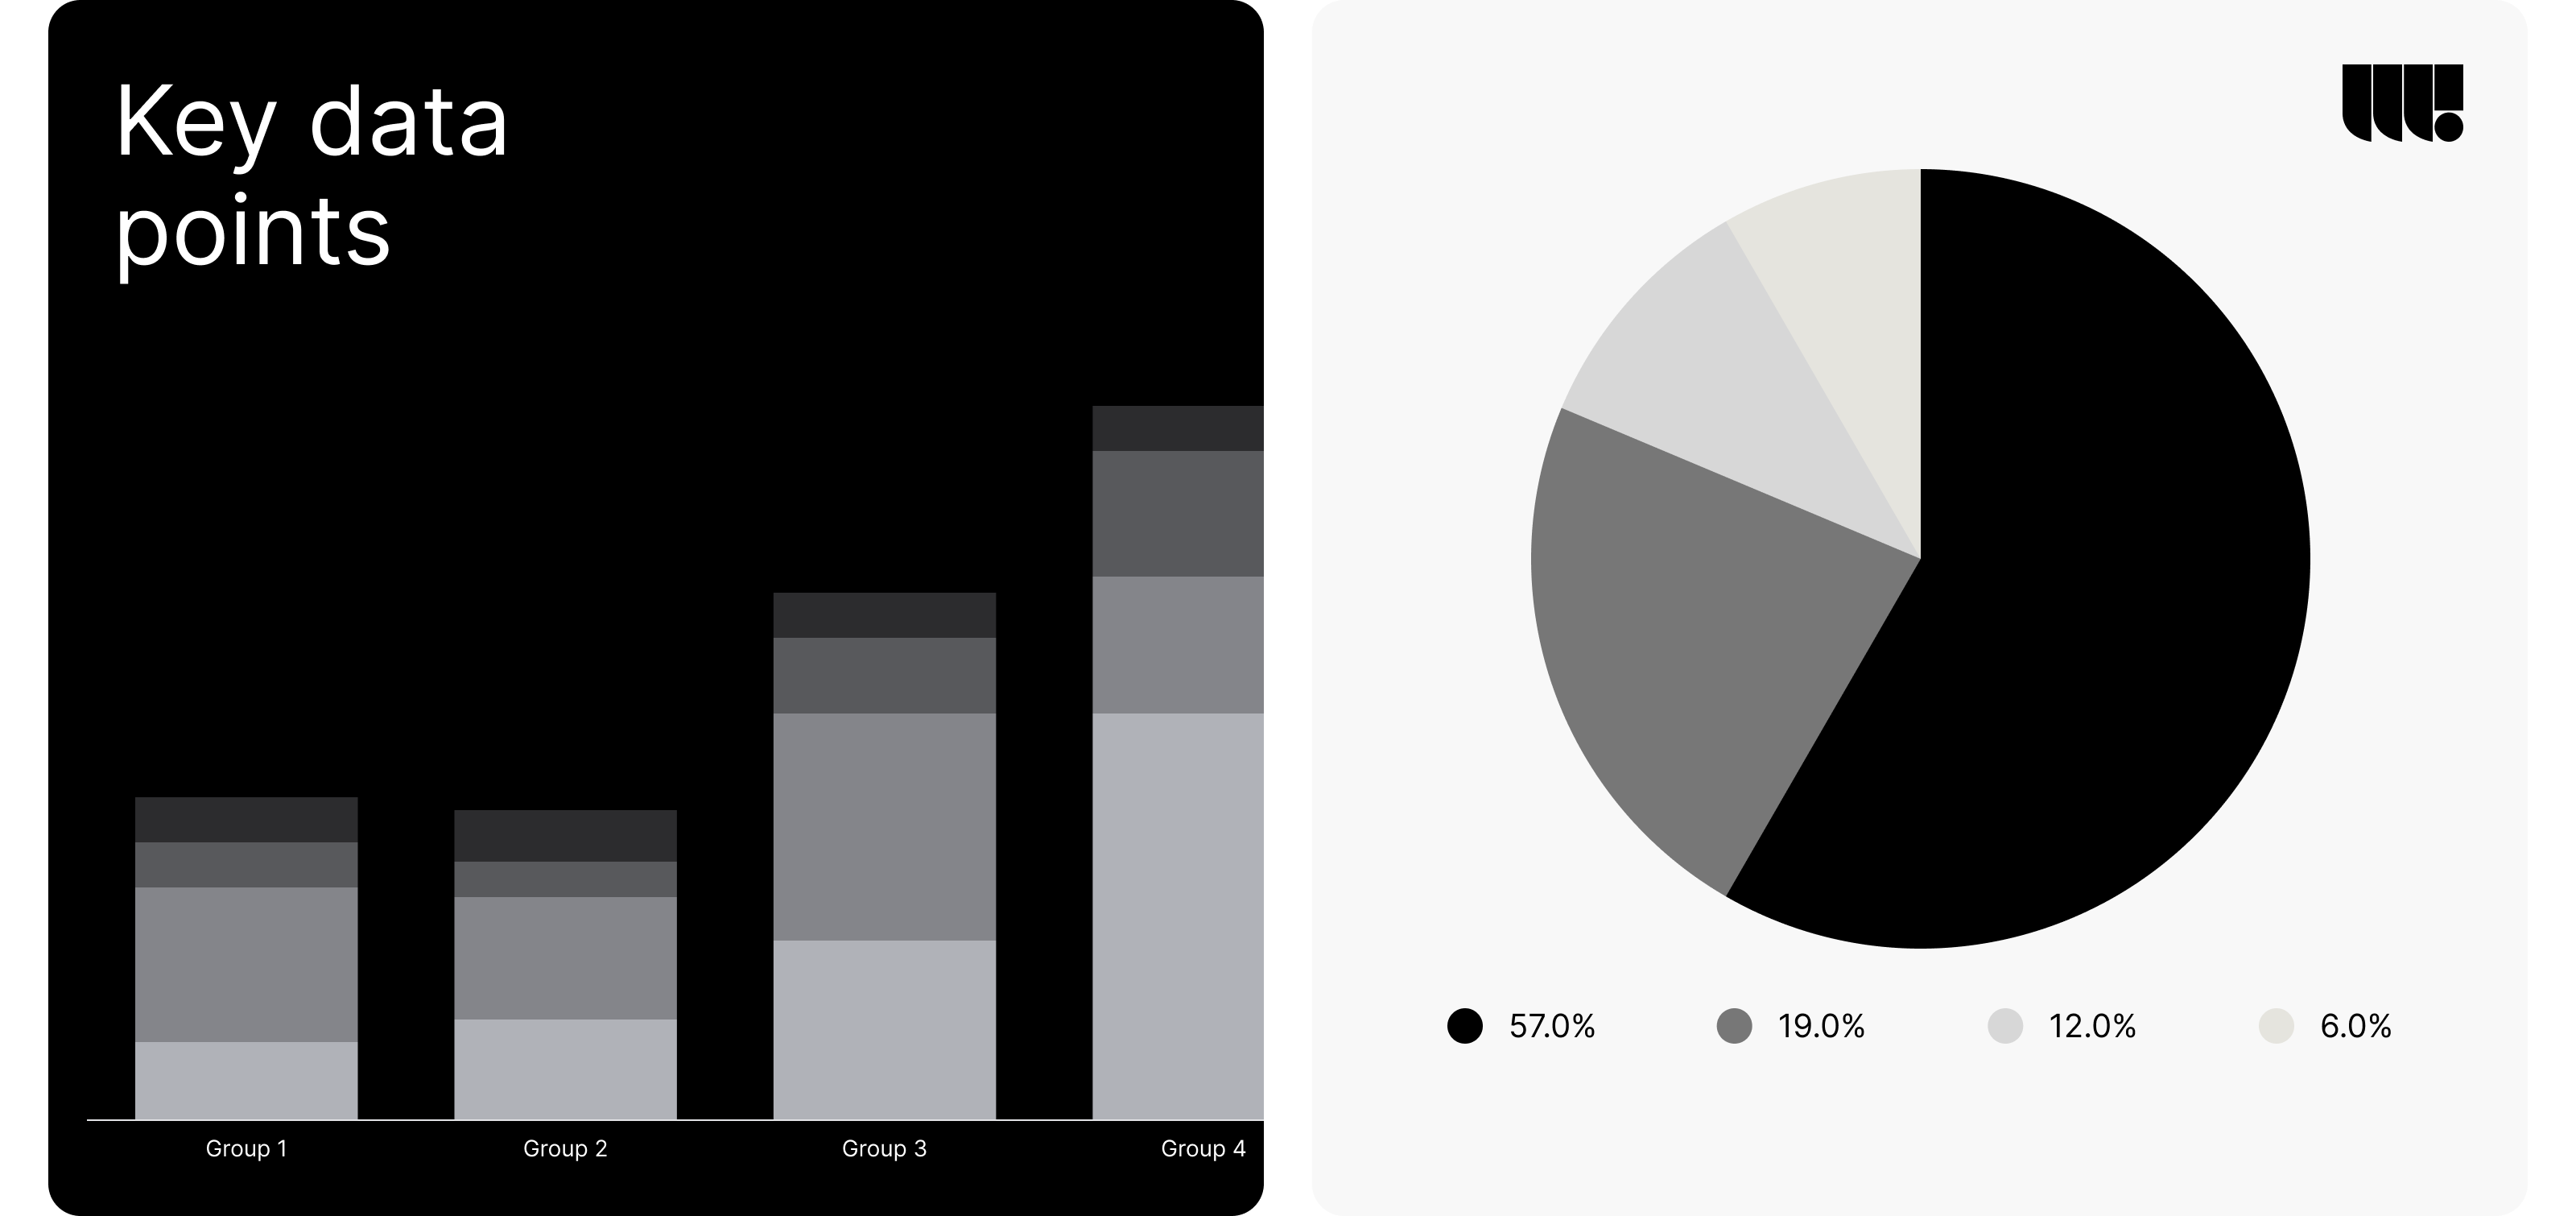
Incorporate visual elements like charts, graphs, and infographics to represent data visually. These elements make complex data more accessible and easier to understand. Visualizations help convey quantitative data in a more digestible format, enhancing the overall clarity and impact of your report.
Make Complex Data Easily Understandable
Ensure that visualizations are clear and accurately represent the data. Use labels, legends, and explanations to enhance comprehension. Effective visualizations highlight key trends and insights, making it easier for readers to grasp the most important aspects of your findings quickly.
13. Provide Actionable Recommendations
Offer Practical Suggestions for Improvement
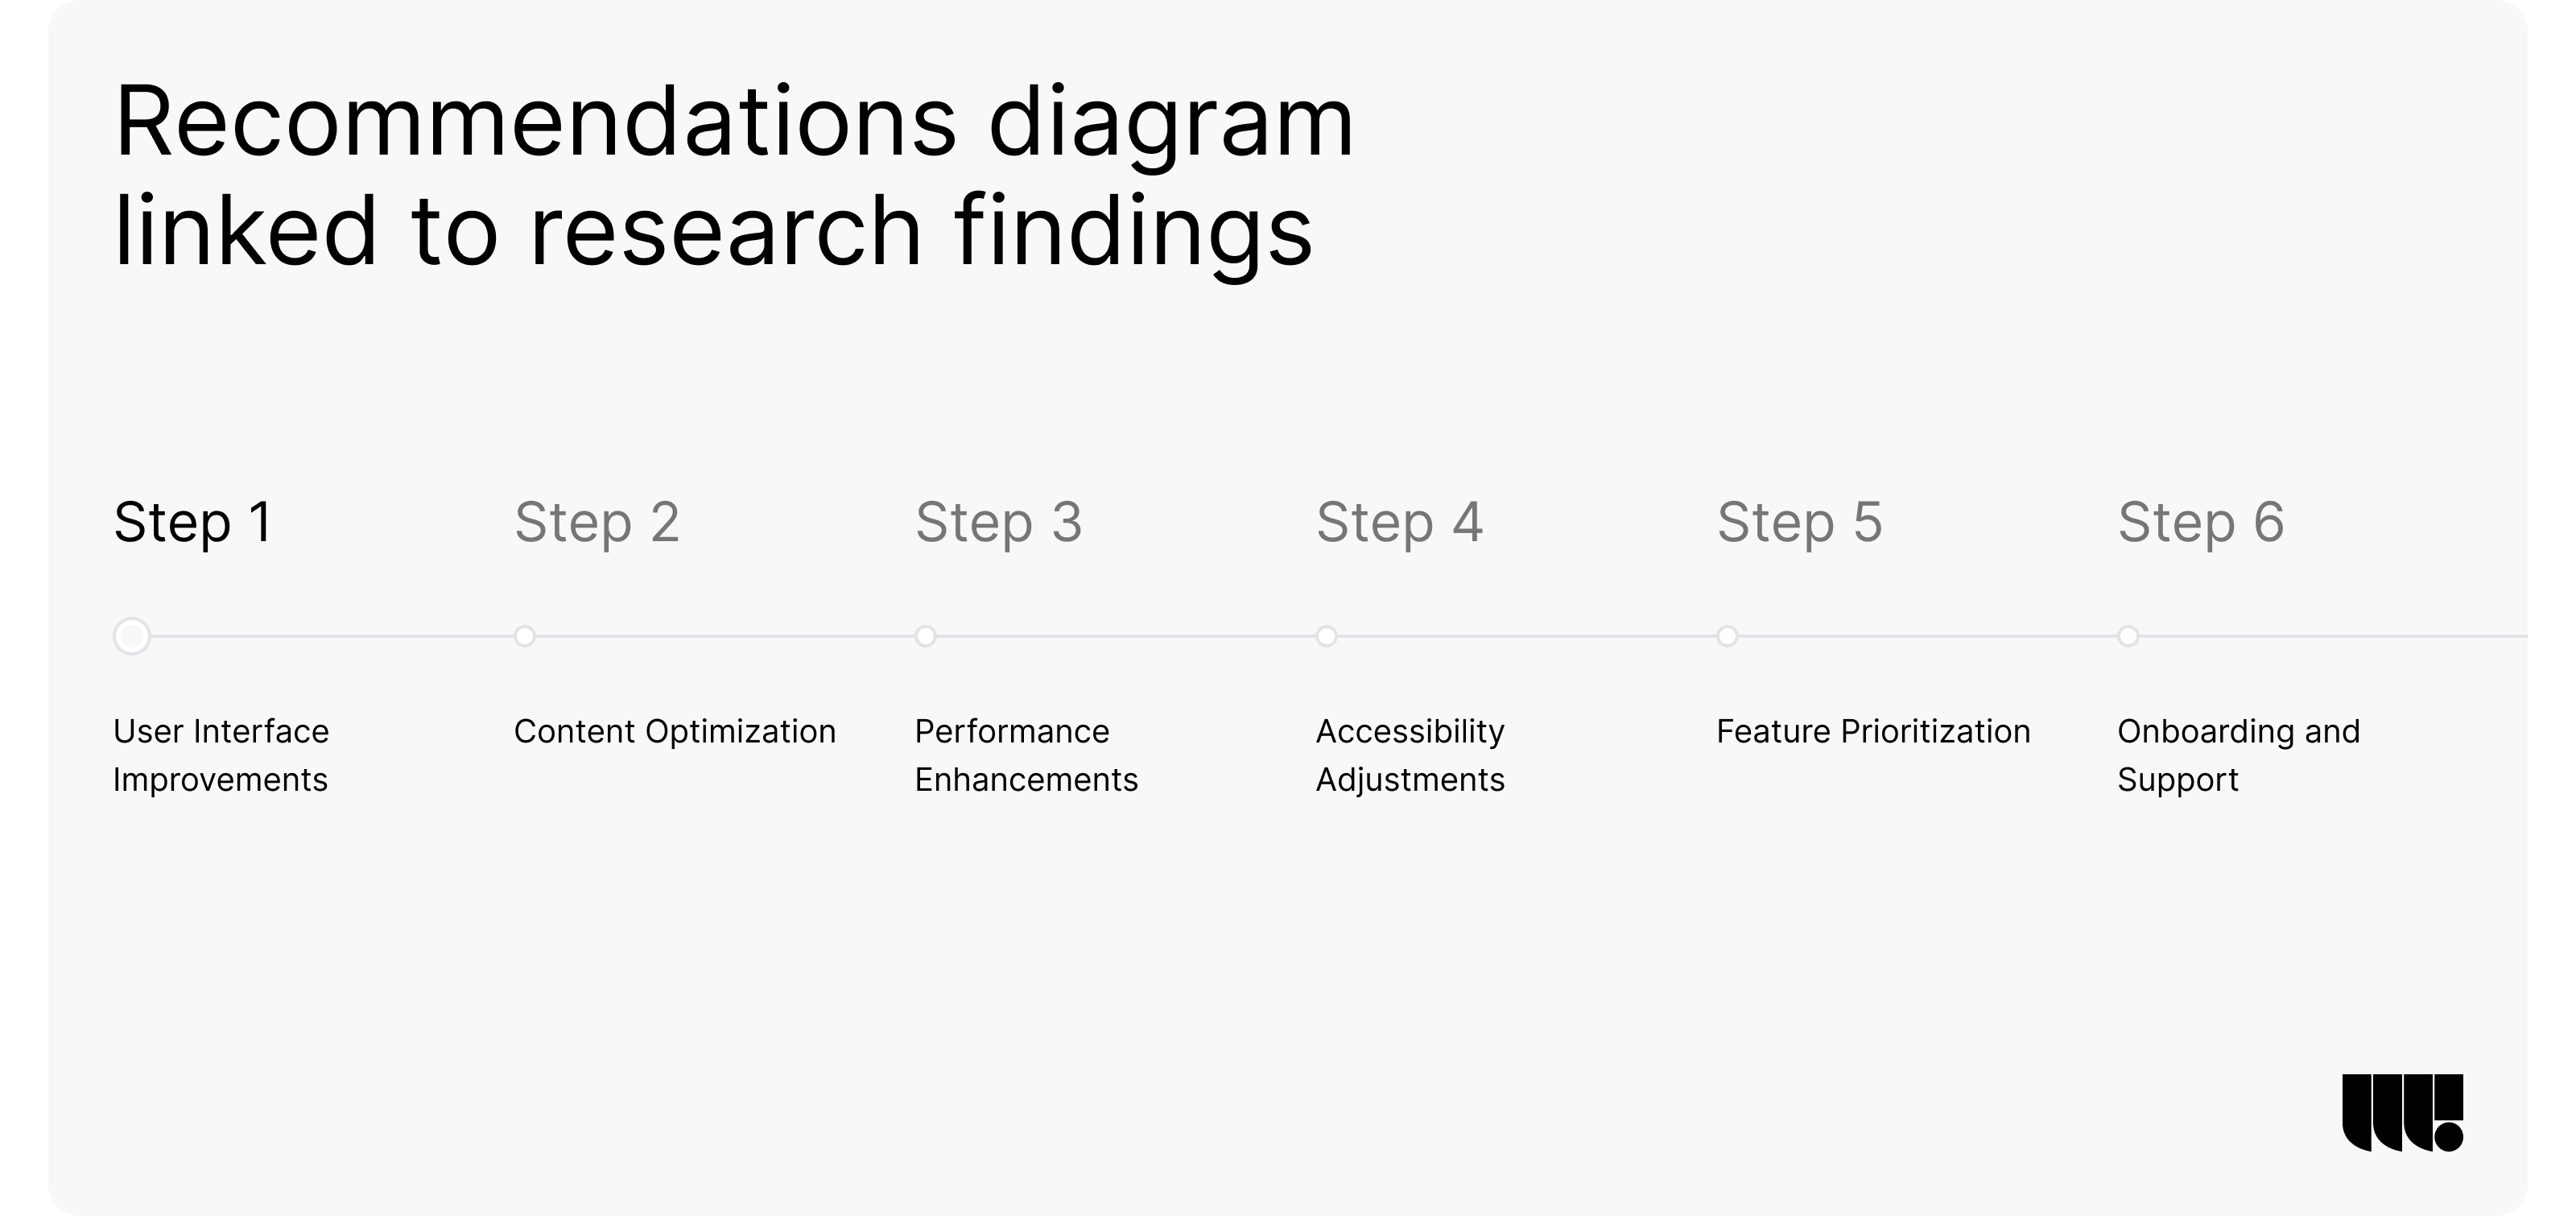
Based on the findings, provide actionable recommendations. These should be practical and directly address the issues identified in the research. Actionable recommendations translate insights into concrete steps that can be taken to improve the user experience, ensuring that your research has a direct impact on design decisions.
Link Recommendations to Research Findings
Clearly link each recommendation to specific research findings. This connection ensures that the suggestions are grounded in data and not arbitrary. Linking recommendations to findings provides a clear rationale for each suggestion, making it easier for stakeholders to understand and support the proposed actions.
14. Review and Revise the Report
Edit for Clarity, Coherence, and Accuracy
Thoroughly review and edit the report for clarity, coherence, and accuracy. Ensure that the document is free of errors and that the information is presented logically. Rigorous editing helps enhance the quality and professionalism of your report, making it more persuasive and impactful.
Seek Feedback from Stakeholders
Gather feedback from stakeholders to refine the report. Their input can provide valuable perspectives and help ensure that the report meets their needs. Engaging stakeholders in the review process helps ensure that the final report addresses their concerns and expectations, increasing its relevance and utility.
15. Distribute and Present the Report
Share the Report with Relevant Stakeholders
Distribute the final report to all relevant stakeholders. Ensure that they have easy access to the document and understand its importance. Effective distribution ensures that your findings reach the right audience, facilitating informed decision-making and action.
Present Findings in a Clear and Engaging Manner
When presenting the report, use engaging presentation techniques to highlight key findings and recommendations. Visual aids and clear explanations can enhance understanding. An engaging presentation helps capture stakeholders’ attention and ensures that the key messages of your report are effectively communicated.
Conclusion
Creating effective UX research findings reports is essential for translating user insights into actionable design improvements. By following this 15-step guide, you can ensure that your reports are comprehensive, clear, and impactful, driving better user-centered design decisions.


